How Did October's Big Sales Do? Looking Beyond the Buzz
The first numbers from October's major promotions are in. How did Amazon Prime Big Deal Days perform? How did the retail giants compare? What do shoppers' baskets tell us? This article examines the newly released spending data, the reasons behind it, and what it means for holiday-season inventory planning.
1. The national picture: $9.86 billion over two days
We outlined how three retailers launched promotions in the same week in “Retail Giants Go All Out: What’s Different About This Year’s October Deals”. Here are the results. Amazon's members-only event ended at 2:59 a.m. Eastern on October 8. On October 8, Chain Store Age and Digital Commerce 360 cited Adobe Analytics data showing that U.S. consumers spent a combined $9.86 billion across retail websites on October 6–7, up 8.5% year over year. The comparable figure last year was $9.09 billion, up 7.3%. Adobe's September 28 forecast was $9.9 billion and 9.2% growth. The actual figure came in slightly below forecast, but growth was faster than last year.
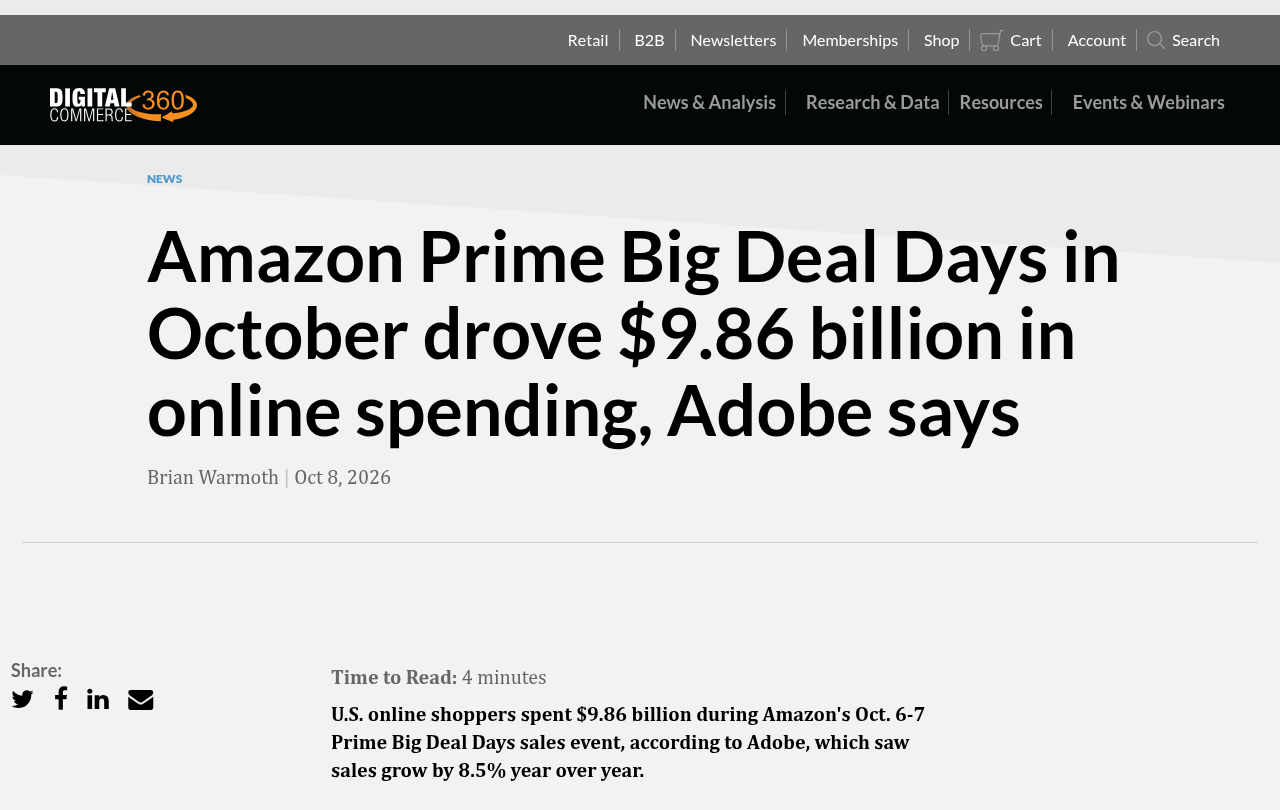
Digital Commerce 360 report page citing Adobe data; accessed October 9, 2026.
One distinction matters: Adobe's figure covers online transactions across all U.S. retailers, including contemporaneous sales at Walmart, Target, Best Buy, and others. It is not Amazon's sales alone. As of the morning of October 9 Eastern, Adobe's newsroom had not published a separate release with the actual figure, so this article relies on the two publications' accounts.
Other data points:
- Discounts: Peak discounts were about 20% off listed prices, with the deepest reductions in computers, televisions, electronics, toys, and apparel.
- Mobile: Orders placed on phones accounted for 52% of online sales, or about $5.1 billion, up roughly 13% year over year.
- Categories: Compared with an average day in September, toys rose 158%, video games 90%, electronics 85%, and personal care 73%; headphones and speakers rose 300%, and smartwatches 255%. Halloween costumes rose 610% and candy 180%. These are comparisons with ordinary September days. Large increases are to be expected during a promotion; they are better read as signs of which categories received a lift than as year-over-year growth.
- Buy now, pay later (BNPL): It represented 6% of orders, or about $692 million.
2. What shoppers bought: inexpensive everyday goods
Adobe shows the size of the market; Numerator shows what went into the basket. When WeCross checked Numerator's tracker on the morning of October 9 Eastern, the page said it had last been updated at 8 a.m. Eastern on October 8:
- How much they spent: Average spending per household was $114.01, about 9% above $104.69 during last year's event. Average spending per order was $48.74, about 7% higher. Fifty-four percent of households placed more than one order.
- Price points: Sixty-eight percent of items cost less than $20 each; only 2% cost more than $100. The average price per item was $23.19.
- Best sellers: Premier Protein shakes, Lysol disinfecting wipes, Scott toilet paper, Dawn Powerwash, and Dunkin' beverage products. Beauty and personal care, apparel, and health and wellness were the most frequently purchased categories.
- Gift buyers: About 20% used the promotion to buy holiday gifts. Among those shoppers, only 18% said they had completed more than half of their gift shopping.
Yes, total spending rose. But most household baskets were filled with everyday goods, and 68% of items cost less than $20.
3. Comparing retailers: Amazon generated the strongest lift
According to first-day Numerator data cited by Supermarket News on October 7:
- Amazon: Household spending on the first day was 48% above a typical Tuesday—more than three times the lift on the first day of Walmart's event. Across two days, Amazon's lift was about four times that of the first two days of Walmart Fall Deals.
- Walmart: Its promotion began October 5 and runs through October 11. A larger share of lower-income households participated, consistent with Walmart's approach of not requiring a membership. Full results will not be available until the event ends.
- Target: Circle Deal Days ran October 6–7 and showed no obvious lift on its first day. The share of Prime shoppers who checked Target's prices fell by eight percentage points year over year. Target's strengths include stores and everyday foot traffic, which may not be fully captured by a 48-hour online panel. At minimum, however, the first day did not show a clear incremental gain.
The shopper mix also differed. High-income households accounted for 43% of Amazon's first-day shoppers. They still compared prices: 55% checked other retailers before buying on Amazon. Walmart was the most common comparison (66%), followed by Target (40%) and warehouse clubs such as Costco and Sam's Club (27%).
4. The broader holiday context
The structure of this promotion aligns with several surveys of the coming holiday season:
- Inflation is pushing shoppers to compare prices. More than seven in ten said inflation influenced whether they participated, according to Numerator's first-day data. Twenty-seven percent used the promotion to offset higher prices, versus 14% last year. August CPI was up 3.4% year over year. AAA's October 6 national average for regular gasoline was $4.37 a gallon, versus $3.13 a year earlier.
- Gift budgets are barely growing. JLL found an average holiday budget of $1,243 per person, up 9.7%, but the gift portion rose only 3.1%. Spending on food and decorations was up 16.0%, while outings, entertainment, and dining rose 17.3%. Bain estimates that inflation will account for more than half of the growth in November–December retail sales.
- The gift season has not been pulled forward completely. Fifty-six percent of Prime shoppers had not decided what to buy for the holidays; 32% thought it was too early to finish shopping; and 83% expected to buy more holiday items from Amazon in the next three months.
This October event was therefore mainly about replenishing everyday goods, comparing prices, and buying Halloween items early. Most gift shopping still lies ahead.
5. What it means for brands: planning Q4
- Low-priced everyday goods led the October event. Sixty-eight percent of items cost less than $20, and the best-seller list was dominated by frequently repurchased products. For brands in household goods, personal care, cleaning, food, and beverages, October can be an opportunity to acquire customers and encourage repeat purchases. Repeat-purchase rates may matter more than a single-event spike. A recent NielsenIQ report also points to faster growth in smaller packs and portion sizes. Offering smaller formats and clearly marked unit prices to supermarkets and convenience stores is consistent with the direction of this data.
- Gift categories should not change course just because October was quiet. Only one in five shoppers bought gifts. The main events are still Black Friday on November 27 and Cyber Monday on November 30. JLL notes that clear $25 and $50 price points and bundled offers appeal to shoppers and can inform Black Friday inventory and pricing. Retailers including Lowe's have announced four weeks of Black Friday-style promotions beginning October 29, so the gift season will start before Thanksgiving.
- Keep cross-channel pricing aligned. Fifty-five percent compared prices before buying, most often against Walmart. Brands sold on Amazon, Walmart, or Target risk losing buyers to a cheaper channel—and facing retailer questions—if their prices diverge sharply. For brands negotiating in-store shelf space, consistent omnichannel pricing is a basic requirement.
- Put Amazon's Q4 dates on the calendar. The AWD Black Friday inbound deadline is October 14; peak-season FBA fulfillment fees begin October 15 (Amazon says the average increase is about $0.32 per item); the Black Friday/Cyber Monday deal-submission deadline is October 20; and FBA inbound dates fall on October 21 and October 28. Prices during October's promotion also do not enter the reference-price lookback window for Black Friday/Cyber Monday deals, so this event's prices need not constrain Black Friday pricing.
- Match channels to income segments. Amazon's shoppers included a higher proportion of high-income households, while Walmart drew more price-sensitive shoppers. A brand can offer different pack sizes, packaging, or bundles of the same product in each channel to fit the audience and reduce direct price comparison.
For a broader view of U.S. holiday spending, see “U.S. Holiday Spending Trends in 2026”.