The U.S. Pet Market: Opportunities and Market Entry Strategies for Chinese Brands
A $158 billion pet market: how can Chinese brands turn online bestsellers into a presence on U.S. retail shelves?
Industry Research · WeCross.US Researcher
Tags: research report; pet brands; physical retail expansion
Data definitions: U.S. totals and market composition use the industry-association definitions in APPA’s State of the Industry. In global comparisons, Europe uses Euromonitor’s pet-care definition, while China uses urban dog-and-cat consumption from the China Pet Industry White Paper. These scopes are not identical and are compared only for scale. Analyst estimates are identified in the text.
U.S. Pet Market Analysis: Size, Growth, Structure and Outlook
1.1 Total Market: Up 54% in Five Years to $158 Billion in 2025
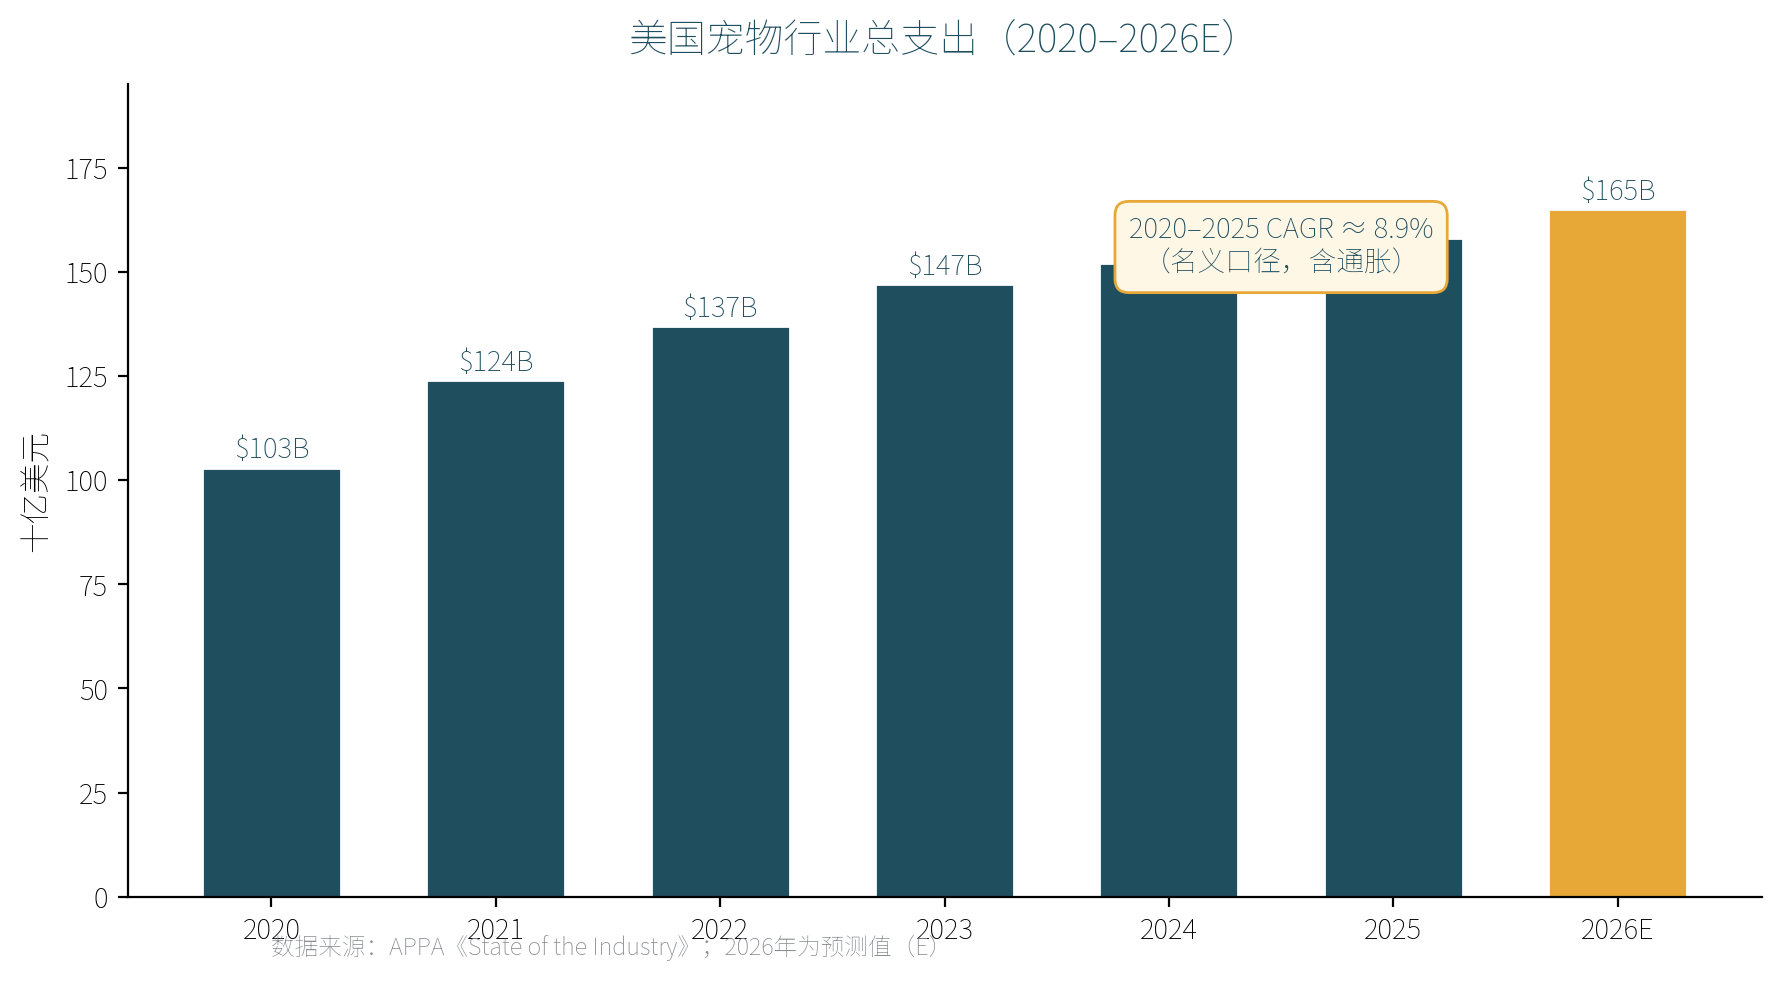
Figure 1: Total U.S. pet industry spending, 2020–2026E
APPA data show total U.S. pet industry spending rising from $103 billion in 2020 to $158 billion in 2025, an absolute gain of $55 billion in five years. That increase alone is roughly equivalent to the size of China’s pet market. Nominal CAGR for 2020–2025 was approximately 8.9%. Spending is projected at $165 billion in 2026, up 4.4%, including about two percentage points of inflation and approximately 2.4% real growth.
Analysis: High inflation in 2021–2023 contributed to the 8.9% nominal growth rate; real growth was more moderate. Even after adjusting for that, this is a large, resilient market: through the pandemic, inflation and debate over consumer trading down, it did not contract in any of those five years. For Chinese brands, this is not a market that requires betting on a passing boom. Choosing the right structural opportunity can support a healthy business.
1.2 Market Structure: Four Segments, with Services Growing Fastest
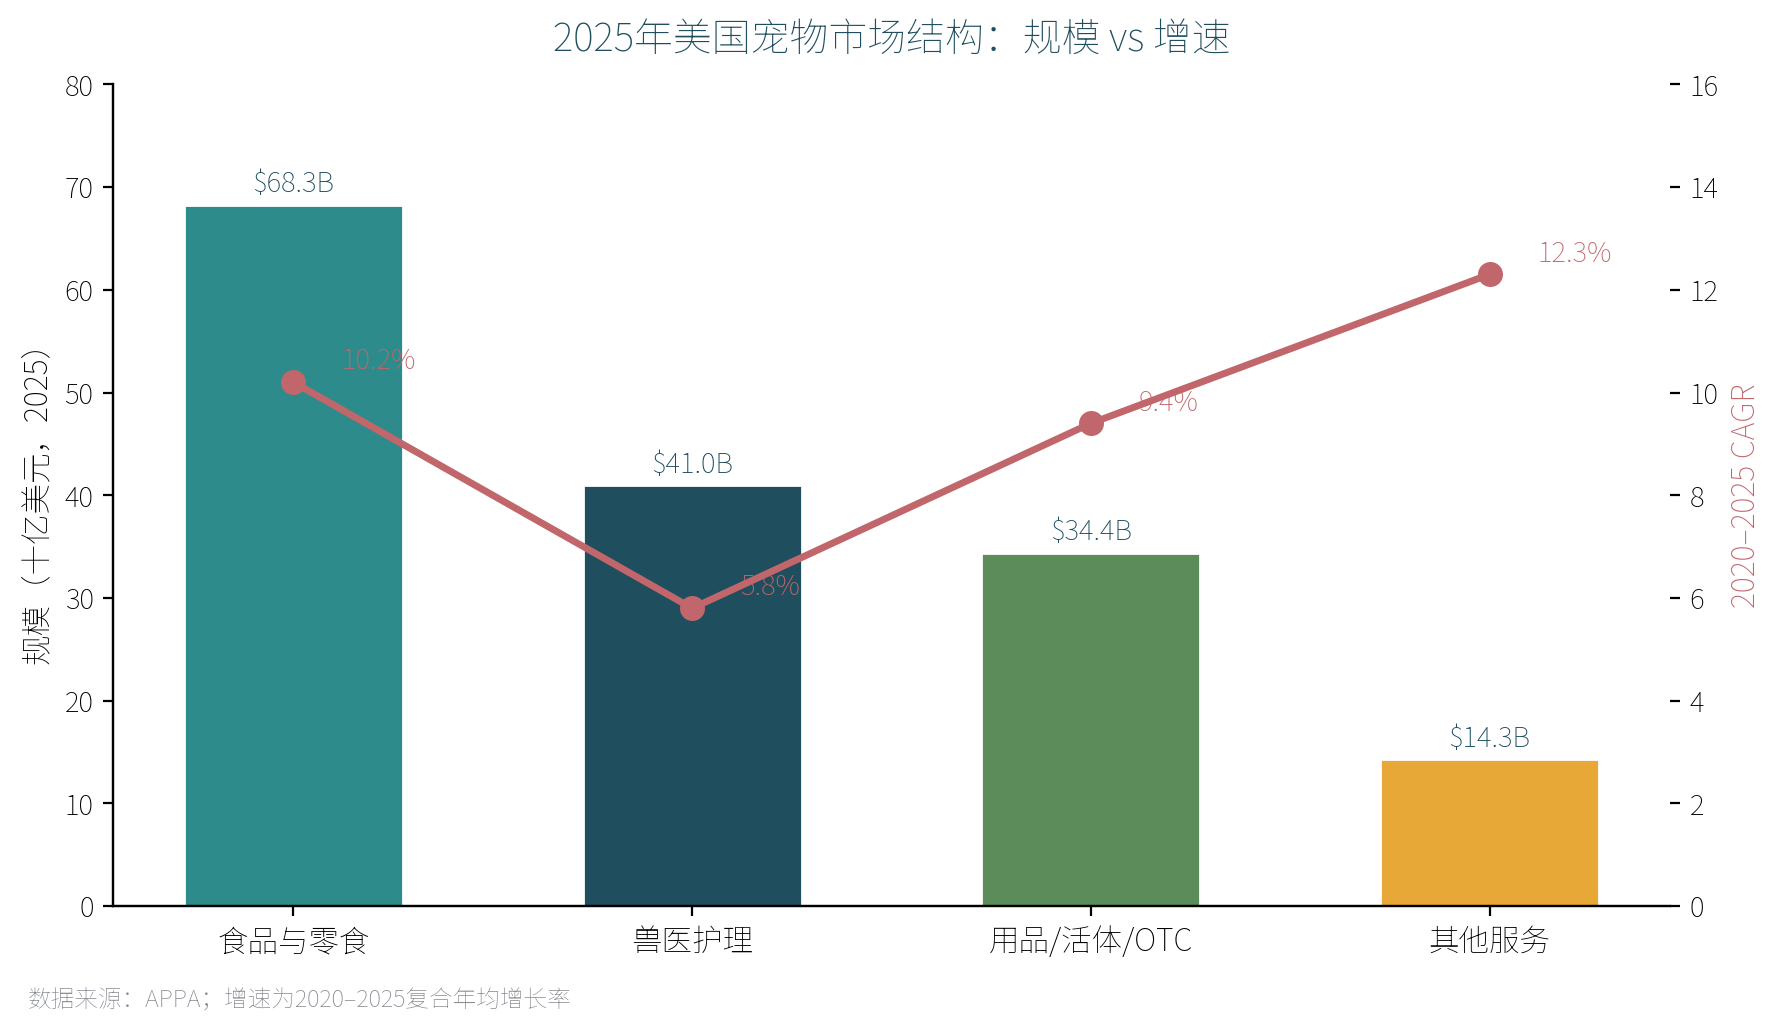
Figure 2: U.S. pet market composition in 2025: size versus growth
The four segments in 2025 were food and treats at $68.3 billion, or 43% of the market, with a 10.2% CAGR; veterinary care at $41 billion, with 5.8%; supplies, live animals and OTC products at $34.4 billion, with 9.4%; and other services such as grooming, boarding and training at $14.3 billion, with 12.3%, the fastest of the four.
Analysis:
- Food remains the foundation at 43%, but the fastest-growing category, other services, reveals a deeper shift: pet humanization has entered an advanced stage. When owners pay more for services rather than products, pets have moved from being possessions to being family members. Chinese brands should shift their product narratives from technical specifications to a family-member perspective: health monitoring, companionship and emotional connection. This is why PETLIBRO’s camera feeders and smart litter boxes can command premiums.
- Supplies, growing at 9.4%, outperform the overall market and are the segment most closely connected to Chinese manufacturing. Supply-chain strengths translate directly into sales, as the next section explores.
1.3 The Fastest-Growing Categories and Their Characteristics: Five Structural Opportunities
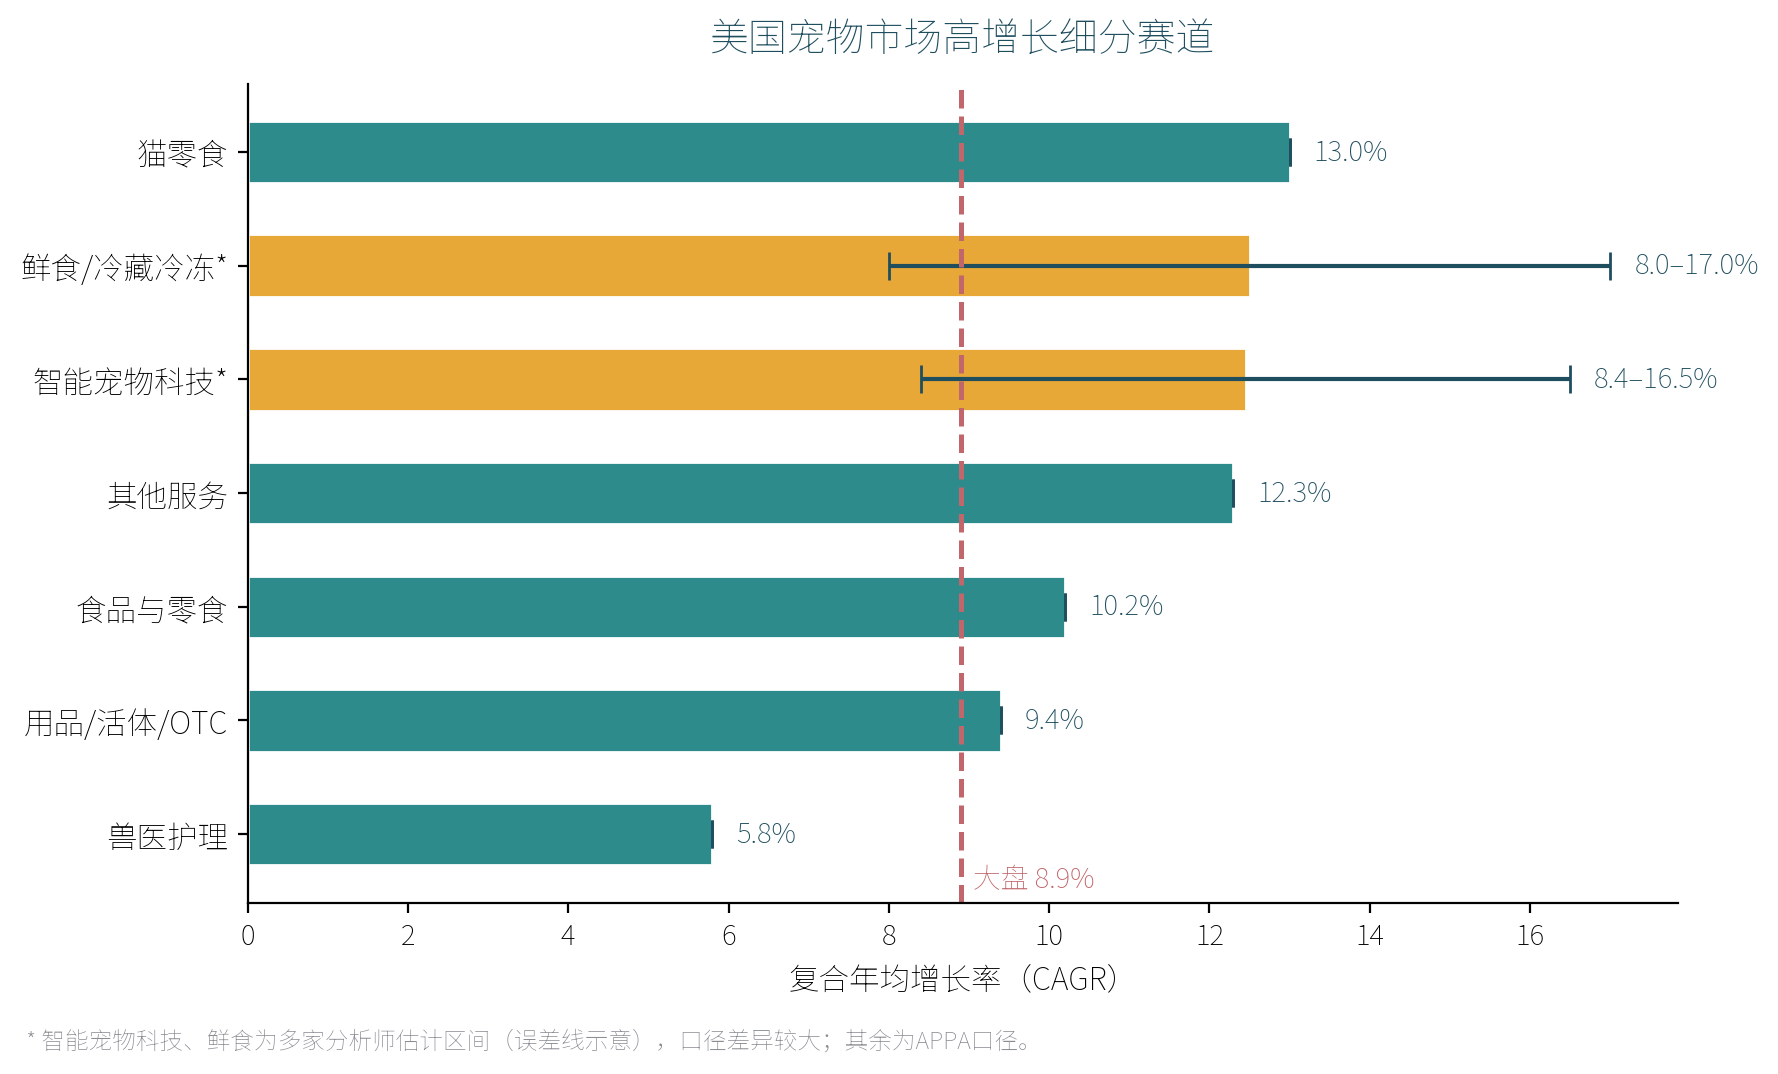
Figure 4: High-growth segments in the U.S. pet market
Across different definitions of high-growth categories, five themes recur:
- The cat economy: U.S. cat-owning households rose 5% year over year, with APPA describing a record-breaking increase in cat ownership. In China, cat spending grew at a 14.2% CAGR in 2018–2024 versus 6.7% for dogs; in 2025, cats grew 5.2% versus 3.2% for dogs. Cat spending is expected to overtake dog spending in 2027–2028. Cat treats have the fastest CAGR among treat types at 13%. Consistent U.S. and Chinese trends suggest structural change rather than a cyclical fluctuation: urbanization, smaller homes and younger pet owners all favor cats.
- Smart pet technology: a market of approximately $2.8–4.1 billion in 2025, with considerable differences in definitions, and CAGR estimates of 8.4%–16.5%. Analysts consistently expect it to significantly outperform the overall market, and APPA also confirms rapid pet-tech expansion.
- Fresh, refrigerated and frozen food: CAGR of 8%–17%, outperforming packaged pet food overall at 3.7%.
- Cat litter and hardware: litter-box hardware at 7.9% and plant-based or natural litter at 6%+, both above overall litter growth of 3.95%–5.7%.
- Pet insurance: $3.6 billion in 2025, up 11%, followed by another 16.8% increase in Q1 2026—further evidence of the shift toward services.
Analysis: The common characteristics of these opportunities are humanization, technology and health. Chinese brands’ supply advantages sit precisely at the intersection of smart hardware and cats, as discussed in Chapter Two. This is not coincidence; it is the alignment of supply capabilities and demand trends. Product selection should stay within this quadrant.
1.4 Global Comparison: The Largest Market and the Fastest Growth over the Past Five Years
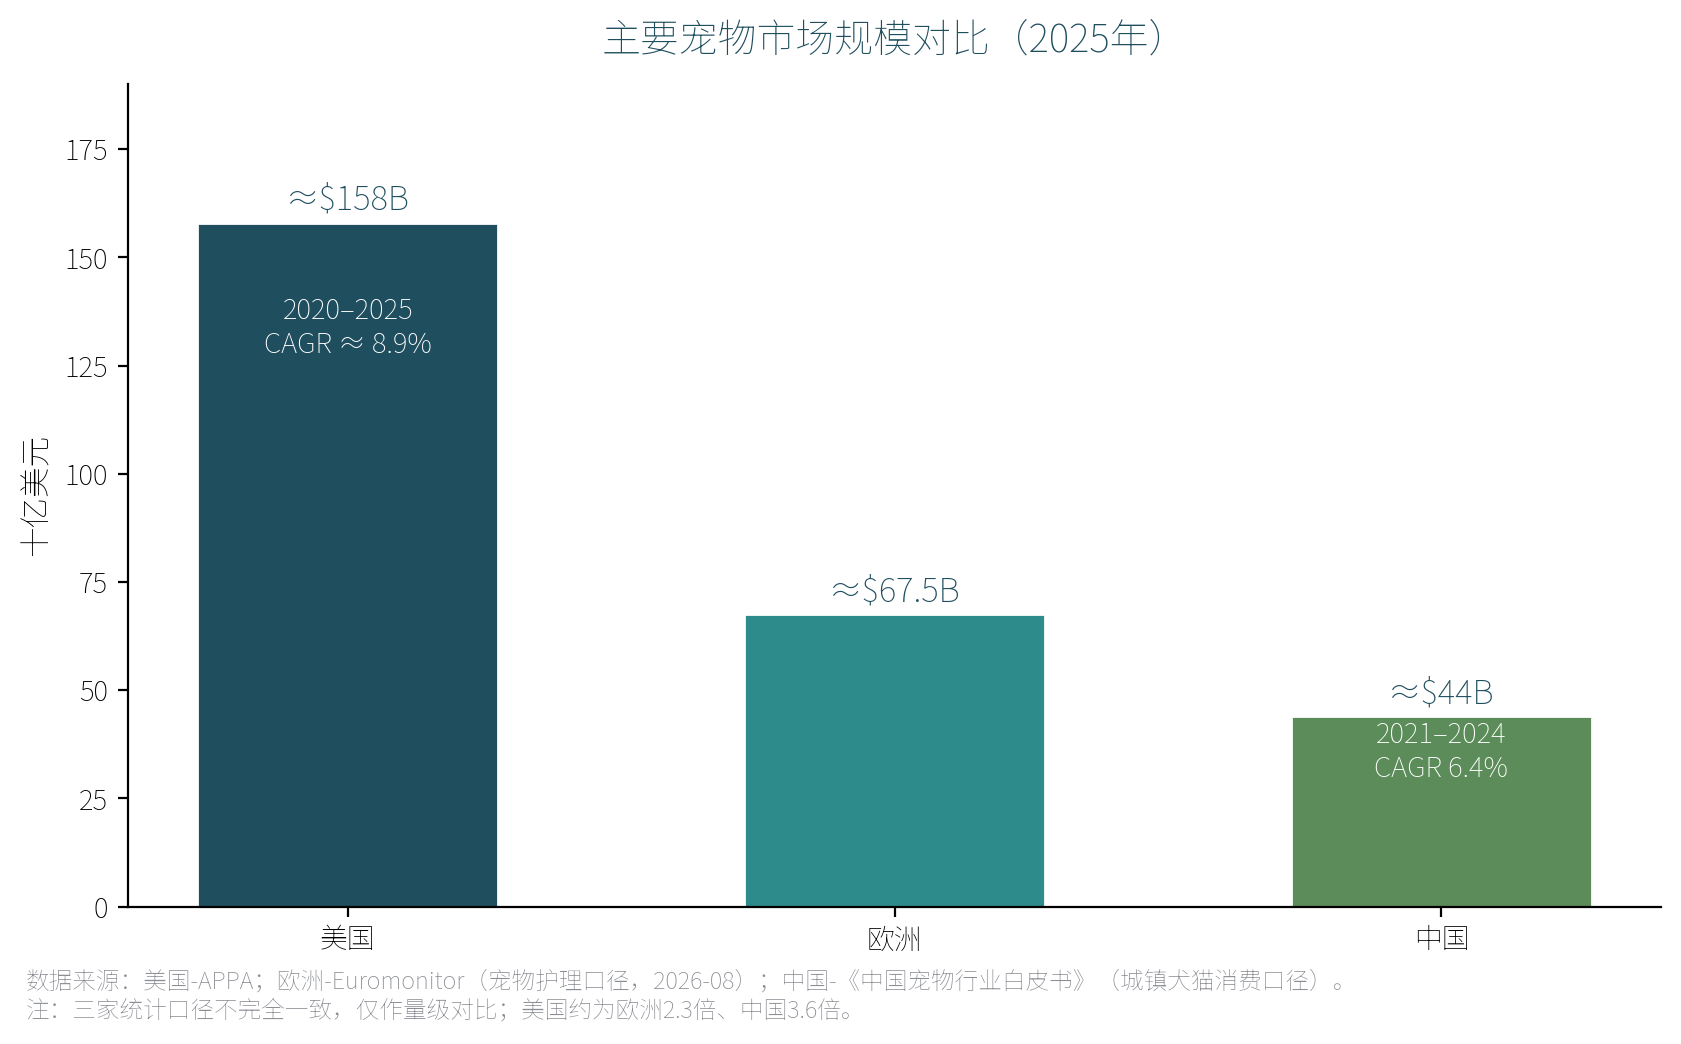
Figure 3: Major pet markets by size, 2025
In 2025, the U.S. market was $158 billion, about 2.3 times Europe’s roughly $67.5 billion and 3.6 times China’s roughly $44 billion under the urban dog-and-cat definition—a commanding lead. U.S. nominal CAGR of 8.9% in 2020–2025 exceeded China’s 6.4% in 2021–2024 under the White Paper definition. Over the past five years, the United States was not only the largest major market but also the fastest-growing in nominal terms. Note that high inflation contributes to the U.S. number, so real growth should be viewed more cautiously; China is projected to recover to approximately 9% in 2025–2028.
Looking ahead, Euromonitor projects a 3% CAGR for North America and 4% for Asia-Pacific through 2031. Asia-Pacific’s growth will overtake North America’s, but the United States will still generate the largest absolute increase globally. The projected U.S. increase from 2025 to 2030 is approximately $84–103 billion, equivalent to creating another 1.5 European markets.
Analysis: For Chinese brands, the U.S. market’s strategic value lies not in a growth story but in scale, willingness to pay and the ability to set trends. U.S.-defined category trends, such as smart feeders and litter boxes, spread globally. Products validated in the United States can enter Europe and Southeast Asia with an overwhelming competitive advantage.
1.5 Outlook: A Large Market with Slower Growth
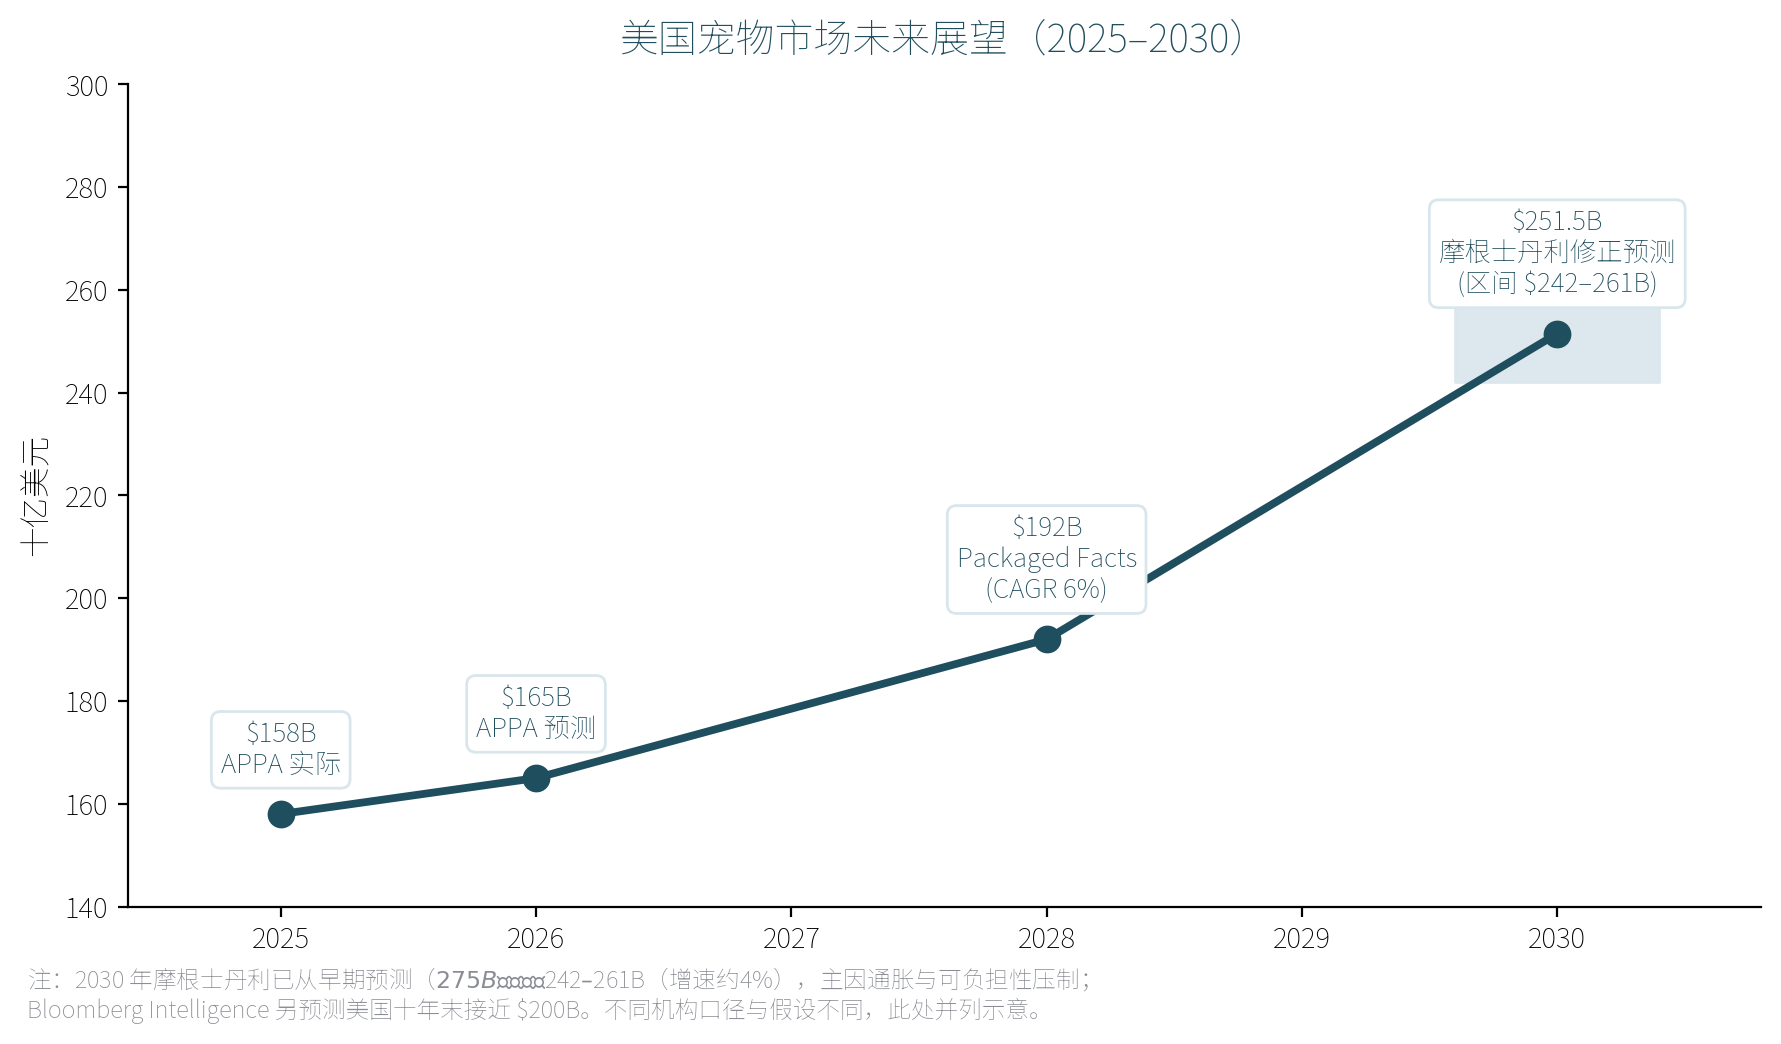
Figure 6: U.S. pet market outlook, 2025–2030
- APPA: $165 billion in 2026.
- Packaged Facts: a 6% CAGR to $192 billion in 2028.
- Morgan Stanley: in 2026, it reduced its 2030 forecast from $275 billion to $242–261 billion, implying approximately 4% growth, mainly because of inflation and affordability pressures.
- Bloomberg Intelligence: the U.S. market approaches $200 billion by the end of the decade, with the global market exceeding $500 billion.
Analysis: With the growth midpoint falling from roughly 9% to roughly 4%, a large but slower-growing market calls for a shift from betting on the overall market to finding structural opportunities. Market beta is thinning; alpha must come from high-growth segments.
Chapter Conclusion: Five Characteristics of the U.S. Market
- A commanding scale advantage: approximately 2.3 times Europe and 3.6 times China.
- High nominal but moderate real growth: the 8.9% figure includes inflation, yet resilience is strong, with no contraction in five years.
- Services and premiumization: services grow fastest at 12.3%, as humanization deepens.
- The cat economy is a cross-market consensus: U.S. and Chinese data point in the same direction.
- 5. Technology is the biggest variable: smart supplies, fresh food and insurance all outperform the market.
Chinese Brands in the U.S.: Highlights, Strengths and Weaknesses
2.1 Highlights: Five Chinese Breakthroughs
Chinese brands are doing more than establishing a presence in the U.S. pet market. In several segments, they are defining the category:
- Smart-feeder category leaders: PETLIBRO, whose brand figures report over three million units sold and a 35% share of Amazon’s smart-feeder category using Stackline data. Its Granary model is a #1 Best Seller in Amazon’s automatic cat feeder category, with nearly 10,000 reviews. PetKit is represented by its Eversweet series.
- Dominating self-cleaning litter boxes: Catlink, sold on Chewy at $219–$399; Meowant, with Amazon BSR positions of #25–42 and availability on Chewy; and Furbulous, which raised over $800,000 on Indiegogo, a pet-category record, and has 742 Best Buy reviews averaging 4.39 stars. U.S. domestic brands are scarcely visible in this segment.
- Litter innovation: design-led pidan, whose litter won a PATS New Product Award in 2025, and Honeycare in pet hygiene, with 6.6K units sold for one TikTok Shop product.
- Water fountains: Veken has multiple #1 Best Sellers in Amazon’s dog and cat fountain categories.
- Grooming tools: oneisall, a Shenzhen company and a representative brand in electric clippers.
2.2 Comparison: Strengths and Weaknesses
| Dimension | Chinese brands’ strengths | Chinese brands’ weaknesses |
|---|---|---|
| Supply chain | Shenzhen hardware ecosystem: fast iteration, cost control and integrated hardware–app capabilities | — |
| Product | Feature-rich and highly intelligent products | Industrial design language and brand stories weaker than established local brands such as PetSafe |
| Price | Strong value in the $100–$400 sweet spot | Heavy reliance on promotions, thin margins and weak pricing power |
| Channels | Highly developed Amazon operations: listings, reviews and advertising | Few physical-retail buyer relationships; unfamiliarity with Chewy/PetSmart systems |
| Trust | — | Very high pet-food trust barriers (see 2.3); costly after-sales service and recalls |
| Marketing | Strong social-media and crowdfunding launch capabilities | Weak U.S. PR, influencer and trade-show infrastructure |
| Compliance | — | UL/ETL certification, warranties and U.S.-based customer service are necessary capabilities and costs |
Analysis: Strengths are concentrated on the supply side: the ability to manufacture, control costs and iterate quickly. Weaknesses are on the demand side: brand, trust and channel relationships. Chinese brands’ first phase is product-led; their next phase must be led by brand and channels. PETLIBRO’s entry into PetSmart represents precisely that transition.
2.3 The Reality: Amazon and OEM Dominate; Branded Pet Food Remains Largely Absent
- Online: Amazon is the primary battleground. Best Seller rankings and review counts are hard currency for buyers. Chewy, Walmart.com, Target.com, Best Buy marketplace, TikTok Shop and brand DTC channels play supporting roles.
- Food: branded retail is largely absent. Yantai China Pet Foods and Gambol Pet Group reported revenue of RMB 3.86 billion and RMB 4.737 billion respectively in the first three quarters of 2025, mainly from OEM and export contract manufacturing. China’s pet industry exports totaled $4.27 billion in 2024.
Analysis: Why this pattern? Branded pet food faces three barriers. First, trust: the collective memory of pet-food safety incidents makes U.S. consumers exceptionally cautious about unfamiliar food brands. Second, regulation: AAFCO standards and FDA oversight make trial and error costly. Third, decision weight: food is ingested, making purchase decisions more consequential than for visible, tangible supplies. OEM first and brands later is a rational strategy. Supplies can first build the perception that Chinese manufacturing means good products, followed by food. This also makes food the next decade’s opportunity for Chinese brands in America. Whoever crosses the trust barrier first can capture the largest piece: food accounts for 43% of the market.
Success Stories: From Online Sales to Physical Retail
3.1 PETLIBRO → PetSmart: The Most Complete Example
Timeline:
- November 2025: launch of the Luma smart litter box at $599.99, with PR announcing entry into PetSmart stores in early 2026.
- March 2026: an official PR Newswire release announced availability on PetSmart.com and in select U.S. stores. Third-party accounts put the initial rollout at nearly 400 stores.
- October 3, 2026, verified directly for this research: the petsmart.com homepage banner read ‘Save up to 20% on ALL Petlibro products,’ and the Granary camera feeder product page offered buy online, pick up in store (BOPIS).
Analysis of enabling factors:
- Online validation first: Amazon category standing—a reported 35% share and #1 category ranking—provided evidence of demand in negotiations with buyers. Data are the only language buyers speak.
- A premium flagship opened the door: the $599.99 Luma filled a gap in Pet Tech rather than competing as a low-price volume item. It helped PetSmart deliver the category upgrade it already wanted.
- U.S. marketing prepared in advance: hiring a U.S. PR agency and running creative Christmas-season marketing in step with the listing schedule.
- A gradual rollout: online warm-up → select stores and the website → sitewide promotions, using data to earn more stores.
3.2 PetKit → Petco.com / Target.com: A Work in Progress
Products are available on petco.com—Eversweet Max, Solo 2 and 3 Pro, with Petco SKUs and customer reviews—and target.com, with Eversweet Solo SE at $24.99. Comparison sites also show the same products at Walmart, Sam’s Club, Tractor Supply and Kohl’s. Current evidence extends only to their e-commerce sites; physical shelf placement is not confirmed. This is an early stage of entering a retailer’s system and can be seen as a precursor to PetSmart-style expansion. Its value is demonstrating that entry into a physical chain’s e-commerce site provides an opening to discuss stores with buyers.
Five Transferable Lessons
- 1. First establish a measurable category position on Amazon: Best Seller status, review counts and third-party share data. These are the essential hard currency in buyer reviews.
- 2. Open the door with a flagship or differentiated product rather than the entire range. Leave promotional room in pricing; PETLIBRO offered 20% off across its range at launch.
- Prepare U.S. PR and marketing in advance: trade shows, press releases and creative campaigns aligned with the listing schedule.
- Accept a gradual rollout: select stores followed by data-driven expansion, rather than all stores at once.
- 5. Compliance and after-sales service: certifications, at least a one-year warranty and U.S.-based customer support. Meowant’s explicit ‘Lifetime US-based support’ is worth learning from. After-sales service is buyer reassurance, not simply a cost.
Recommendations for Chinese Pet Brands
Strategy: Choosing the Right Category Matters More than Effort
- Stay at the intersection of high growth and Chinese supply strengths: smart supplies, litter and cat products, and equipment supporting fresh food. Food companies should pursue OEM before branded products or enter demanding niches such as functional treats, rather than attack mainstream pet food head-on.
- Prioritize cats: the cat economy is a structural trend shared by the United States and China. Growth in cat-owning households, the 13% CAGR for cat treats and 7.9% for litter-box hardware all point to the same conclusion.
- Pricing: target the $100–$400 sweet spot and leave retailers 20% promotional room. Giving buyers scope to run offers is an often-overlooked bargaining chip.
Channels: The Standard Path and Pace
- The standard four steps: Amazon validation through Best Seller status and thousands of reviews → Chewy, Target.com or Petco.com to enter retailer systems → select-store physical pilots → data-driven expansion. Every step requires data; without data, there is no next step.
- Do not start by seeking a nationwide PetSmart rollout. Regional chains such as the Pet Supplies Plus franchise system, Hollywood Feed and Mud Bay offer direct buyer access and lower barriers, making them excellent pilot grounds.
- Mass-market channels require another approach: validate first through Walmart Marketplace. Tractor Supply, with 2,364 stores, an expansion of fresh food from 80 to 700 stores in 2026 and greater emphasis on cats, offers underestimated growth—building outward from rural markets toward cities.
Operations: Make Weaknesses into Standard Capabilities
- Put compliance first: UL/ETL certification, at least a one-year warranty and U.S.-based customer service. These are buyer veto points, not bonus features.
- Put marketing first: a U.S. PR agency, influencer reviews and trade shows, aligned with the listing schedule. PETLIBRO’s Christmas-tree campaign shows that creative marketing can become a direct talking point in buyer meetings.
- Plan a 12-month calendar around trade shows: use Global Pet Expo in March for distributors and regional chains, and SuperZoo in August for physical retail pilots. Chapter Six provides details.
Risks
- Tariffs: against the background of Section 301 measures on China, evaluate U.S. assembly or production, taking inspiration from Korean kimchi brand Jongga’s California factory model.
- Platform dependence: Amazon policy and fee changes are systemic risks; diversify through Chewy, DTC and physical retail.
- After-sales costs: smart-hardware returns and customer support are hidden profit killers and must be included in pricing.
The U.S. Pet Retail Landscape: Online and Offline
5.1 Online: Approximately 35% Share, Growing Two to Three Times Faster than the Market
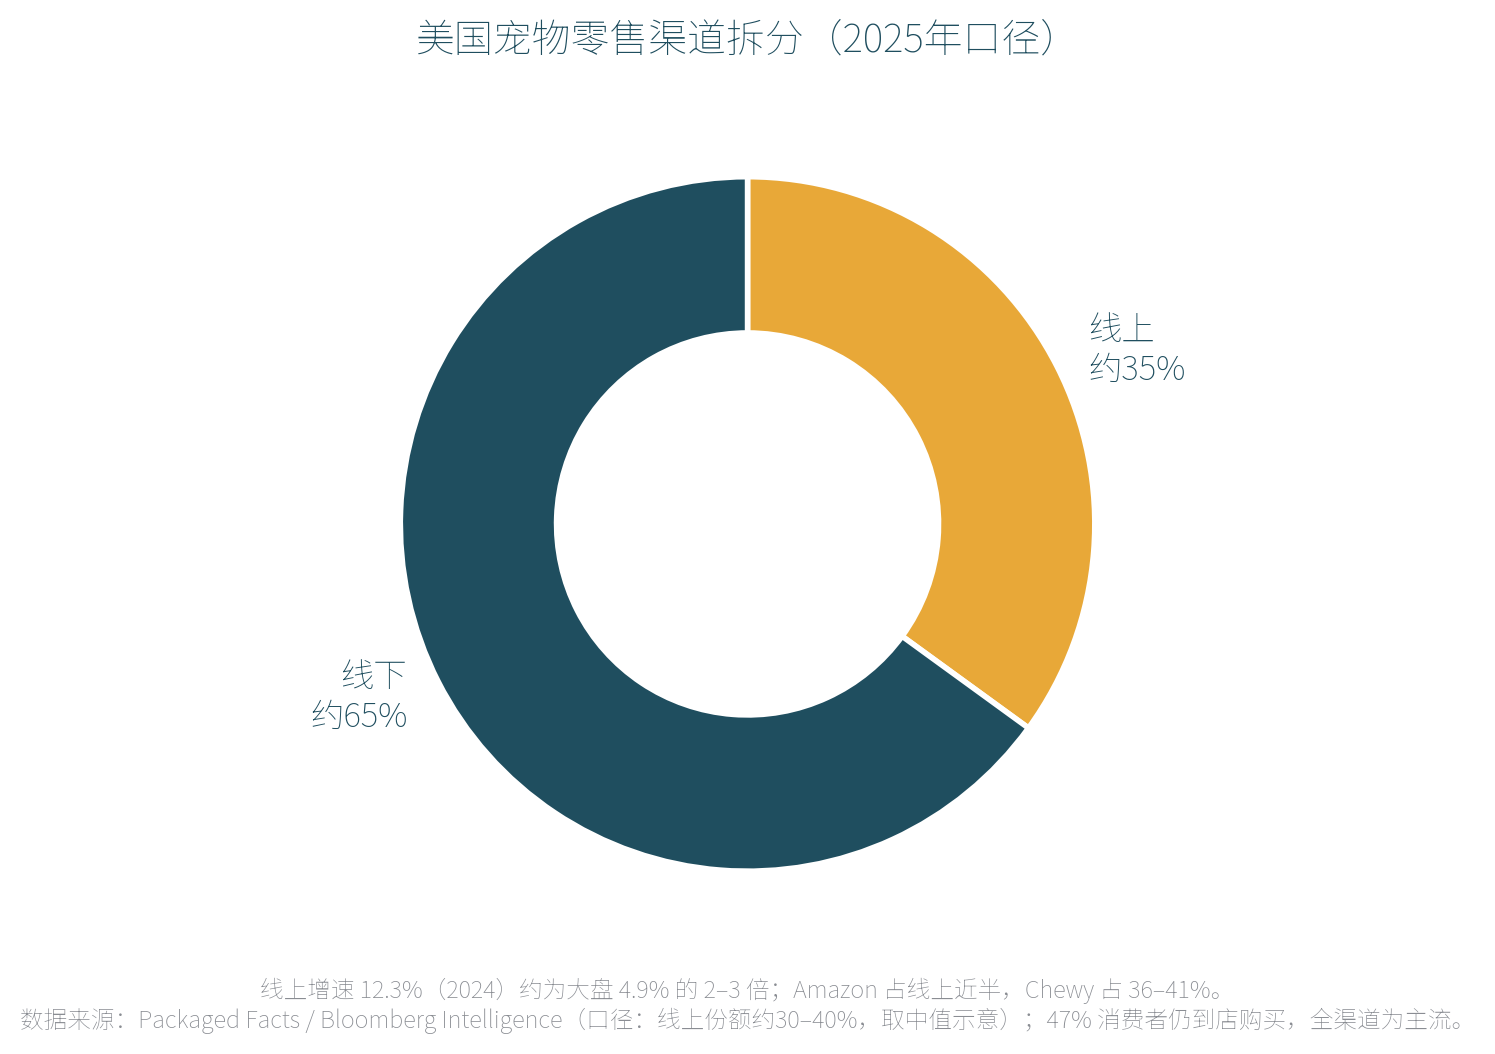
Figure 5: U.S. pet retail channel breakdown
Online share is approximately 30%–40%, illustrated here at roughly 35%. Online growth was 12.3% in 2024, about two to three times the overall market’s 4.9%. Amazon accounts for nearly half of online activity, Chewy for 36%–41% and Walmart for roughly 33%, with overlapping measurement scopes. Bloomberg Intelligence forecasts U.S. online sales doubling to $60 billion by 2030. Yet 47% of consumers still buy in stores. Omnichannel is mainstream; online-only and offline-only approaches are minorities.
Analysis: Online is the validation ground for data, reviews and rankings; physical retail is the amplifier of scale and brand recognition. Chinese brands’ first phase is online, but their growth ceiling depends on physical retail. PETLIBRO and its peers are demonstrating this.
5.2 An Introduction to U.S. Physical Pet Retail
| Retailer | Store footprint | Positioning | Model / geography | Implications for Chinese brands |
|---|---|---|---|---|
| PetSmart | 1,665 stores | Mass-market comprehensive retailer, upgrading Pet Tech | Company-operated nationwide | Highest entry barrier and greatest benchmark value; start with select stores |
| Petco | 1,382 stores at year-end 2025; FY2025 sales $6 billion, down 2.5% | Mass-market comprehensive retailer focused on health and services, with 100+ in-store veterinary hospitals | Company-operated nationwide | Seeking change under pressure; more open to innovative categories; use RangeMe |
| Pet Supplies Plus | 729 locations | Neighborhood stores, natural and specialty-formula food | Franchised across 33 states | Franchising means access through headquarters and distributors; staff recommendations carry weight |
| Pet Supermarket | 155 stores in 11 states | Premium / holistic health in the Southeast | Company-operated, owned by Roark | Regional concentration makes it suitable for a Southeastern pilot |
| Hollywood Feed | 175+ stores | Premium natural, healthy and holistic | Company-operated, expanding nationwide | Emphasizes ingredients and natural attributes; smart devices need a health-monitoring story |
| Mud Bay | Approximately 64 stores, 2023 data | Natural products in the Northwest | Company-operated in Washington and Oregon | Strict selection criteria; useful for building brand positioning |
| Pet Food Express | Approximately 64 stores, 2023 data | California, natural-only | Company-operated in California | Very strict on food; supplies and smart devices are relatively more accessible |
| Kriser’s | 19 stores, single source | Natural neighborhood stores | Company-operated in Chicago | Lower barriers, suitable for testing |
| Chuck & Don’s | Approximately 49 stores, 2023 data | Minnesota neighborhood stores | Company-operated | Direct access to regional buyers |
| Bentley’s Pet Stuff | 93 stores | Natural products in the Chicago area | Company-operated | Direct access to regional buyers |
| Tractor Supply | 2,364 stores plus 206 Petsense locations | Farm and rural lifestyle | Company-operated nationwide | Underestimated growth: fresh food expands from 80 to 700 stores in 2026, with greater emphasis on cats; values competitive pricing and large packs |
| Walmart / Target / Costco | 4,600+ / 2,000 / 600+ stores, general-reference estimates | Mass market / middle class / membership | Company-operated | Validate first on Walmart Marketplace; Costco is very difficult and requires large packs and a stable supply chain |
Analysis: U.S. physical retail is not monolithic. It has three layers: the two dominant chains set benchmarks, regional chains provide pilot opportunities, and farm channels offer incremental growth. Chinese brands often focus only on PetSmart and Petco, whereas regional specialty chains can be the most cost-effective entry point: direct buyer access, quick decisions and regional data validation, followed by negotiations with the two giants.
Playbook Summary: General Rules of U.S. Pet Retail
- 1. Validate online, then scale offline: without Amazon data, buyers will not talk to you.
- 2. Specialty channels want health and natural-product stories; mass channels want value for money. The same product needs different pitches at Hollywood Feed and Walmart.
- 3. Franchising and distributors are central to regional penetration: Pet Supplies Plus’s 729 franchised locations are reached through both headquarters and distributors.
- 4. Services matter: Petco operates veterinary hospitals and Hollywood Feed develops knowledgeable staff. Channels are embracing humanization too, and favor brands that help them tell a health story.
Entering Physical Retail: Distributors, Listing Processes and Trade Shows
6.1 Three Main Entry Points: How to Approach Them
PetSmart: the highest barrier
- Contact the merchandising team. A third-party guide lists Merchandising2@PetSmart.com.
- Prepare retail-ready packaging, suggested retail prices and promotional room, evidence of supply-chain capacity, a marketing support plan and Amazon sales data, including Best Seller screenshots and review counts.
- Negotiation strategy: do not begin with nationwide distribution. Start with select-store pilots and PetSmart.com, then use three to six months of data to earn expansion.
Petco: more open to innovation
- Create a vendor profile on RangeMe.com, where buyers search by category.
- Prioritize health and innovation, including terms such as smart health monitoring and natural ingredients in the profile.
- With FY2025 sales down 2.5%, Petco is hungrier for new categories that can generate growth. This is an opening.
Chewy: online specialty retail
- Apply through Chewy Partner Hub.
- The model is traditional wholesale retail or dropshipping, not an open marketplace. Meet retailer standards for packaging, barcodes, EDI and returns policies.
- Catlink and Meowant have demonstrated this route.
6.2 Two Major Distributors: The Main Route to Regional Penetration
- Phillips Pet Food & Supplies: founded in 1938, with 10 distribution centers serving independent pet shops, aquatics, farm stores, groomers and veterinary channels. Once a national distribution agreement is signed, independent retailers can add orders directly through Phillips without opening separate vendor accounts with each brand. This is the lowest-cost way to reach the long tail of stores.
- Animal Supply Company (ASC): a leading U.S. pet distributor that continues adding brand partners, with a coverage model similar to Phillips.
How to work with them: practical steps
- 1. Prepare a distributor package: product range, MSRP and distributor pricing, marketing support through samples, displays and promotions, and supporting Amazon data.
- Contact distributor buyers or brand-onboarding teams to negotiate initial orders and geographic coverage.
- 3. After entering the distributor’s catalog, proactively pitch independent stores and regional chains in target areas. The distributor provides lists; the brand handles sell-in.
- 4. Use two to three quarters of sell-through data to approach larger chains.
6.3 General Requirements Checklist: Before Entry
- ☐ Retail-ready packaging: English, barcodes and compliance labels
- ☐ Competitive pricing with promotional room for retailers
- ☐ Reliable supply chain and safety stock: stockouts are buyers’ greatest frustration
- ☐ Marketing support plan: samples, displays and joint promotions
- ☐ Certifications such as UL/ETL and at least a one-year warranty
- ☐ U.S.-based customer service and a returns process
- ☐ Quantifiable evidence of Amazon sales
6.4 Overview of Two Core Trade Shows
Global Pet Expo 2026: March 25–27, Orange County Convention Center, Orlando
- The industry’s largest B2B show, with the strongest concentration of distributors and chain buyers.
- Honeycare exhibited in 2025 and expanded its booth, showing that Chinese brands already use the event to connect with channels.
- Recommended activities: launch products, meet Phillips and ASC, and arrange meetings with regional chain buyers.
SuperZoo 2026: August 12–14, with education on August 11, Mandalay Bay, Las Vegas
- Over 22,000 professional attendees, 1,100 exhibitors, 350,000 square feet and 2,000 new products; one in eight attendees is international, representing 70 countries.
- More focused on new products and trends, with WPA releasing petLENS market intelligence at the same time.
- Recommended activities: advance physical retail pilots, gain media exposure and observe competitors.
Appendix: Data Definitions and Main Sources
- U.S. totals and composition: APPA State of the Industry, actuals for 2020–2025 and projections for 2026.
- Global comparisons: Euromonitor, August 2026, using the pet-care definition; China Pet Industry White Paper, using urban dog-and-cat consumption.
- Channels: Packaged Facts and Bloomberg Intelligence’s 2025 Pet Economy Report.
- Outlook: Packaged Facts, Morgan Stanley’s revised 2026 forecasts, and Bloomberg Intelligence.
- Brands and cases: brand websites and PR releases; Amazon, Chewy, PetSmart, Petco and Target product pages verified on October 3, 2026; EqualOcean; and USPTO.
- Retailers and distributors: company financial reports, including Petco FY2025; Chain Store Age; Entrepreneur; PetfoodIndustry; and the RetailBound 2026 guide.
*Data in this report are current through October 3, 2026. A small portion of cited data comes from single sources and could not be cross-verified. This report is for business judgment only and does not constitute legal advice.*